 Bestå
Bestå
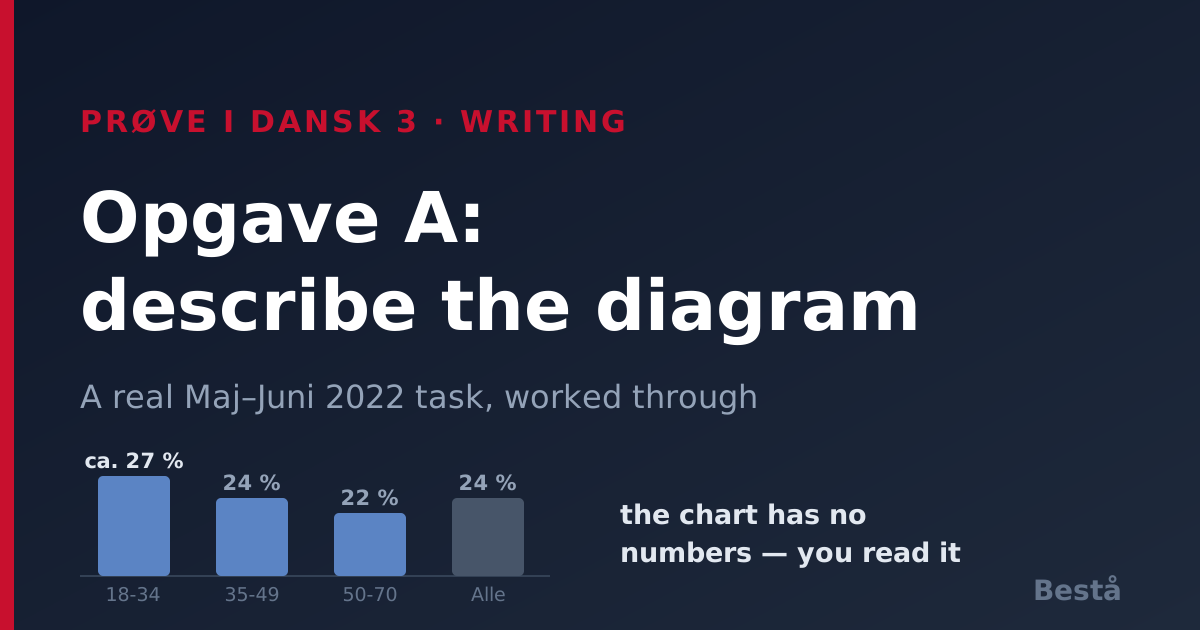
In PD3 Delprøve 2 you choose between Opgave A and Opgave B. Opgave B asks you to write from experience. Opgave A gives you a diagram — and that scares people off, usually for the wrong reason. Opgave A is not harder Danish. It is a different first step: before you write anything, you have to read a chart correctly and say what it shows in precise, hedged Danish.
That first step is completely learnable. Here is the whole thing worked on a real task from Maj–Juni 2022.
The task
2A: Klimabekymring og alder
Andel personer i forskellige aldersgrupper, der er meget bekymrede over klimaforandringer — a bar chart with four bars on a 0–30 % scale: 18-34 år, 35-49 år, 50-70 år, Alle.
Undersøgelsen er foretaget blandt et repræsentativt udvalg på 2.000 personer i alderen 18-70 år. Kilde: https://ida.dk
Opgave:
- Beskriv kort hovedtrækkene i diagrammet.
- Fortæl, hvilke årsager der kan være til de forskelle, diagrammet viser.
- Hvilke fordele og ulemper mener du, der kan være for samfundet ved, at unge bekymrer sig om klimaforandringerne? Begrund dine synspunkter. (Besvarelsen af dette punkt skal udgøre ca. 50 % af den samlede besvarelse.)
Du skal skrive minimum 200 ord.
1. The chart has no numbers on it — and that is the point
Here is the detail that catches people out: in the exam booklet, the bars are not labelled. There is a y-axis marked 0 % to 30 % in steps of 5, and four unlabelled bars. Nobody hands you the figures.
Reading this chart, the four bars sit at roughly:
- 18-34 år — just above the 25 % line, so ca. 27 % (clearly the tallest)
- 35-49 år — a little under 25 %, so ca. 24 %
- 50-70 år — around ca. 22 % (the lowest)
- Alle — level with 35-49, so ca. 24 %
You are expected to approximate. That is why hedging language is not optional padding here — it is accuracy. Write ca. 27 %, omkring en fjerdedel, knap 25 %, godt 20 %. A candidate who writes "27,3 %" is being less accurate than one who writes "ca. 27 %", because the chart does not support that precision.
The habit: before writing a single sentence, note the highest bar, the lowest bar, and the gap between them. Here: highest 18-34, lowest 50-70, spread of only about 5 percentage points.
2. Say the main trend first, then the detail
Beskriv kort hovedtrækkene — the main features. Not every bar in sequence. Censors want to see that you can identify a pattern, not that you can read four numbers aloud.
The pattern here: concern falls as age rises, and the overall spread is small.
"Diagrammet viser, hvor stor en andel af forskellige aldersgrupper der er meget bekymrede over klimaforandringerne. Det generelle billede er, at bekymringen falder med alderen: de 18-34-årige ligger højest med ca. 27 %, mens de 50-70-årige ligger lavest med ca. 22 %. Gennemsnittet for alle adspurgte er ca. 24 %. Forskellene mellem grupperne er dog forholdsvis små."
Note the last sentence. Pointing out that the differences are small shows genuine interpretation — and it is true here. Most candidates overstate the gap.
Keep this bullet short. It is the setup, not the essay.
3. The Danish you need for describing data
This is the vocabulary that separates a confident Opgave A from a hesitant one:
Proportions and quantities
- andelen af… · en fjerdedel · knap en fjerdedel · godt en femtedel · procentpoint
Position and comparison
- ligger højest / lavest · topper med… · til sammenligning · i forhold til… · mens…
- forskellen mellem X og Y er på ca. 5 procentpoint
Trend
- falder med alderen · stiger med alderen · er nogenlunde konstant · følger samme mønster
Hedging (essential here)
- ca. · omkring · knap · godt · cirka en fjerdedel · tæt på
Framing the source
- Undersøgelsen er foretaget blandt… · ifølge undersøgelsen · tallene bygger på et repræsentativt udvalg
One precision point worth learning: procentpoint, not procent, for the gap between two percentages. Going from 22 % to 27 % is a difference of 5 procentpoint. Getting this right is a small, very visible marker of B2 control.
4. Bullet two: give causes, and hedge them too
Fortæl, hvilke årsager der kan være til de forskelle, diagrammet viser.
You are not expected to know the real answer — you are expected to reason plausibly in good Danish. Note the modal framing in the task itself: der kan være. Mirror it.
Two or three developed causes beat five listed ones. For this task:
- Younger people will live longer with the consequences — de skal leve med konsekvenserne i mange årtier endnu.
- Climate has been part of schooling and youth media for this generation — klima har fyldt meget i undervisningen og på sociale medier.
- Older groups may weigh other concerns more heavily — andre bekymringer som økonomi og helbred kan fylde mere.
Useful frames: "En mulig forklaring kunne være, at…", "Det hænger formentlig sammen med, at…", "En anden årsag kan være, at…"
5. Bullet three is half your text — plan for that
The task states it outright: this point must be ca. 50 % of the whole answer. If your text is 260 words, roughly 130 belong here.
It also asks a genuine both-sides question — fordele og ulemper … for samfundet — and then begrund dine synspunkter. So you need advantages, disadvantages, and a reasoned position of your own.
- Fordele: political pressure, greener consumption, innovation and green jobs — unges engagement lægger pres på politikerne · efterspørgslen efter bæredygtige produkter stiger
- Ulemper: climate anxiety and wellbeing, polarisation between generations — klimaangst kan påvirke unges trivsel · risiko for konflikt mellem generationer
- Your position, with reasons: "Efter min vurdering vejer fordelene tungest, fordi…"
Connectors that carry this section: "På den ene side… på den anden side…", "En klar fordel er, at…", "Omvendt kan det være et problem, at…", "Alt i alt mener jeg, at…"
6. A structure you can reuse on any Opgave A
Four paragraphs, in this order:
- Indledning + hovedtræk — what the chart shows and the main pattern (short)
- Årsager — two or three plausible, hedged explanations
- Fordele og ulemper — both sides, developed (this is the long one)
- Konklusion — your reasoned position
Give each its own paragraph. A wall of text is harder to read and costs you on structure and cohesion.
Should you choose A or B?
Choose A if you are comfortable with numbers and would rather describe something concrete than invent a personal story. The chart hands you your opening paragraph — there is no blank page.
Choose B if data vocabulary feels shaky, or if you have a real experience that fits. Both are marked to the same criteria; neither is worth more. Decide in the first minute and commit — switching halfway is what actually costs people the exam.
Related guides
- PD3 Skriftlig Opgave — the writing exam guide — the email task, Opgave A vs B, and how the written part is graded.
- PD3 writing: Opgave B on sundhedstilbud — the same walkthrough treatment for the other option.
- PD3 grades and pass mark — how writing is weighted in your final result.
- 7 mistakes that fail PD3 candidates — including writing without the structure censors mark against.
Practise Opgave A in Bestå
Write your own answer to a diagram task against the clock, then get feedback on structure, argumentation, grammar and vocabulary — graded on the official 00–12 scale. Download free on iOS and Android.